Frequency Weighting of Signal Levels
Most animals, including humans, marine mammals, and fishes, have varying sensitivity to sounds of different frequencies. Because animals do not hear equally well at all frequencies, frequency weighting is a method to quantitatively account for these differing sensitivities, particularly when considering whether a sound might affect an animal’s hearing.
For humans, equal loudness curves are used to determine the perceived loudness for sounds at different frequencies. For example, the relative sound intensity has to be much greater for a low frequency sound (e.g., 100 Hz) to be perceived as loud as a sound at a frequency that humans hear well, such as 1,000 Hz. The phon is a unit of loudness; the number of phon of a sound of interest is the decibels of a 1 kHz sound that is perceived to be just as loud as the sound of interest. The 40-phon equal-loudness function, called A-weighting and the 100-phon function, called C-weighting, are used to filter environmental noise and optimize hearing aids, sound level meters, and other measurement devices for human hearing sensitivities.
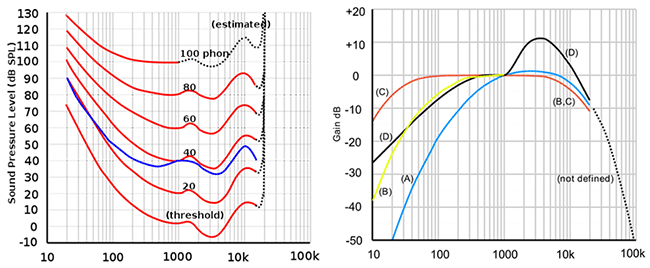
Left side – Equal Loudness Contours are shown in red. The y-axis (vertical) is relative intensity in decibels referenced to 20 µPa. The x-axis (horizontal) is the frequency of a sound on a logarithmic scale. The contour lines are lines of equal perceived loudness for sounds at different frequencies Numbers above the lines are in phons. The graph was made by reference to the ISO 226 :2003 standard. Right side – Acoustic Weighting Curves for humans. A-weighting blue, B weighting yellow, C weighting red, and D weighting black. Both images are public domain.
Because of the difficulty in training marine mammals to obtain equal loudness data, only one study has been conducted[1]Finneran, J. J., & Schlundt, C. E. (2011). Subjective loudness level measurements and equal loudness contours in a bottlenose dolphin ( Tursiops truncatus ). The Journal of the Acoustical Society of America, 130(5), 3124–3136. https://doi.org/10.1121/1.3641449. Instead, marine mammal frequency weighting has been traditionally based on audiograms. The first frequency weighting functions proposed for marine mammals were termed “M” functions (for marine mammals) and are analogous to the C-weighting functions of humans. The M-weighting functions de-emphasize frequencies that are near the upper and lower limits of the estimated hearing range of each type of hearing group (mysticetes/low-frequency cetaceans, mid-frequency cetaceans, and high-frequency cetaceans, pinnipeds under water, and pinnipeds in air).
The net effect of frequency weighting is that sounds at frequencies outside of those to which an animal is most sensitivity must be louder to have the same level of potential impact as a sound at a frequency to which an animal is more sensitive.

Weighting functions for marine mammals||M-weighting functions for marine mammals. The “pinniped in water” curve (turquoise line) is overlapped by the “pinniped in air” curve (magenta line) at frequencies below 1,000 Hz (Southall et al. 2007).
References
- Southall, B. L., Bowles, A. E., Ellison, W. T., Finneran, J. J., Gentry, R. L., Greene, C. R., … Tyack, P. L. (2007). Marine mammal noise exposure criteria: Initial scientific recommendations. Aquatic Mammals, 33(4), 411–414. https://doi.org/10.1578/AM.33.4.2007.411
Cited References
| ⇡1 | Finneran, J. J., & Schlundt, C. E. (2011). Subjective loudness level measurements and equal loudness contours in a bottlenose dolphin ( Tursiops truncatus ). The Journal of the Acoustical Society of America, 130(5), 3124–3136. https://doi.org/10.1121/1.3641449 |
|---|