How is hearing measured?
Hearing is an important sense for most animals. However, all animals do not hear all sounds. For example, people can’t hear the sound a dog whistle makes, but dogs can hear that sound. Most marine mammals can hear sounds that people can’t hear. What sounds we, or a marine animal, can hear depends on the frequency of the sound and the intensity of the sound. For people, the sounds we hear best are those used in conversation. The sounds animals hear best are critical for survival like the sounds of predators, prey, and mates.
You may have had a hearing test. The person being tested sits in a very quiet room with headphones. Sounds are played at different frequencies and intensities, and the person indicates when they hear a tone. This is called a behavioral hearing test.
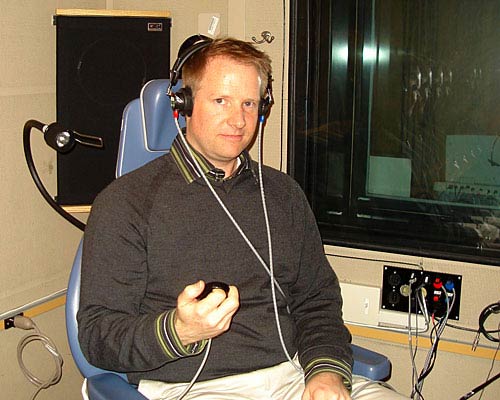
Person having a hearing test. The device in their hand is used to signal when they hear a tone. Image from National Institute of Heath.
Behavioral hearing tests are conducted on animals that can respond if they hear a sound. In many instances, however, animals cannot respond, such as newborn babies or untrained animals. Another method for measuring hearing is by recording electro-physiological responses of the auditory system. The response of the auditory system is estimated based on the electrical activity of different parts of the central (brain) auditory system. Small electrodes placed on the surface of the animal’s head record the voltage produced when sounds of different frequencies and intensities are played. To actually test the ear itself, an electrophysiological test of the cochlea (inner ear), called an “Oto-acoustic Emission” test or OAE, can be conducted. In this test, a probe that contains a microphone and a speaker is placed in the ear. Sounds are generated by the probe and sounds the come back from the cochlea are recorded.
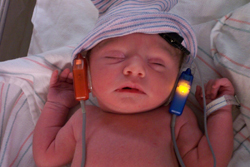
An electro-physiological hearing test on a newborn baby. (www.dhss.mo.gov/NewbornHearing/)
These types of hearing tests determine what frequencies and sound levels can be heard at the time of the test. This information can be displayed in an audiometric curve (see figure below). An audiometric curve shows the range of sounds that people can hear, with frequency on the x-axis and sound level or intensity on the y-axis. In the figure below, the hearing of many individuals has been summarized to show the sounds that people with normal hearing are able to hear (light green area), in the context of where human speech falls (dark green area).

An audiometric curve shows the range of sounds that people can hear. It is bound on the bottom by the hearing threshold and at the top by the perception limit. Graph by P. Minary, from “Journey into the World of Hearing” www.cochlea.eu/en/accueil-en/ by R. Pujol et al., NeurOreille, Montpellier.
The softest sound that an animal can hear at a specific frequency is called the hearing threshold. In the audiometric curve above, the hearing threshold defines the lower limit of what can be heard. An audiogram, or hearing curve, shows the sound level required for an animal to just detect sounds across the frequencies that it can hear.
Audiograms are often displayed differently for people than for other animals. Human audiograms often plot the threshold of hearing relative to a standardized curve representing normal hearing. Therefore, the units of the y-axis are decibels hearing level, cited as dB HL. Below is an audiogram for a human. The red “O”’s represent hearing in the right ear, the blue “X”s represent hearing in the left ear. Normal hearing is classified as being between -10 dB HL and 15 dB HL.
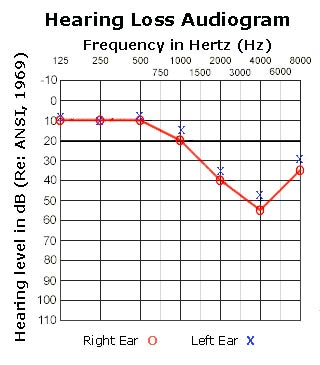
A human hearing curve showing hearing loss above 500Hz in both the right (red “O”s) and left (blue “X”s) ears. Image adapted from OSHA.
As people get older, it is common to lose hearing at higher frequencies. The graph below illustrates hearing loss for an older person. The green shaded area represents the hearing loss, indicating that louder sounds are needed at these frequencies in order for the person to hear them. The greater the number, the higher the degree of hearing loss. The blue area of the graph is called the “speech banana.” It shows the frequencies and sound levels of typical speech sounds.
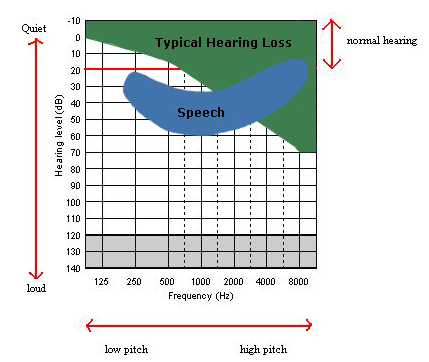
An audiogram showing the area of typical hearing loss in an older person (green region). The blue region is called the “speech banana” and shows the area of common parts of speech. Image URI/DOSITS
Of people aged 23 to 44 years old, 23% have some hearing loss. This increases to 43% for people 65 years old and older. Typically, only people under the age of about 20 years old can hear at 17,000 Hz or higher. You can test the highest frequency you can hear at this website: http://www.ultrasonic-ringtones.com/.
An audiogram for a beluga whale is shown below. It is different from the human audiogram because sounds are plotted relative to a reference pressure of 1 microPascal. The shaded region above the curve represents sounds that a beluga can hear. Below the curve, sounds are inaudible; that is, they cannot be heard by beluga whales. The lowest point on the curve indicates the frequency where the animal can hear best, about 40,000 Hz for beluga whales as shown in the figure below.

Hearing threshold curve for the beluga whale. The vertical y-axis is relative (threshold) intensity in dB re 1 µPa. The horizontal x-axis is the frequency of sound on a logarithmic scale in Hz. The lowest point on the curve indicates the frequency where the animal can hear best, about 40,000 Hz for beluga whales, as shown in the pink box on the x-axis. Graph from data in Castellote, M., Mooney, T. A., Quakenbush, L., Hobbs, R., Goertz, C., & Gaglione, E. (2014). Baseline hearing abilities and variability in wild beluga whales (Delphinapterus leucas). Journal of Experimental Biology, 217(10), 1682–1691.
Every hearing animal has a “best frequency range” of hearing. This range usually has some practical biological and/or energetic significance. For example, people hear best in the frequency range of speech because it is most important for us as apex predators to hear and understand one another. For the beluga whale, the frequency of best hearing occurs at the upper end of their communication range and the lower end of their echolocation range.
Additional Links on DOSITS
Additional Resources
- National Institute for Occupational Safety and Health (NIOSH) – What Does a Hearing Loss Sound Like?
- HyperPhysics – Sensitivity of the Human Ear
- Journey into the World of Hearing
References
- Office of Naval Research. (2001). Final Environmental Impact Statement for the North Pacific Acoustic Laboratory, May 2001 (p. 400). Arlington, VA: Office of Naval Research.
- Moore, B. C. J., Glasberg, B. R., & Baer, T. A. (1997). A model for the prediction of thresholds, loudness, and partial loudness. Journal of the Audio Engineering Society, 45(4), 232.
- Ketten, D. R. (2002). Marine mammal auditory systems: a summary of audiometric and anatomical data and implications for underwater acoustic impacts. Polarforschung, (72), 79–92.