How is sound used to map the seafloor?
High-resolution maps of the seafloor (bathymetric maps) are important for ship navigation, geological research, habitat and ecosystem studies, and military activities. From antiquity to World War I, the depth of the ocean was measured by using a weighted rope with markings on it. Once sonar became commercially available after World War I, sound was used to find the depth of the ocean. Low resolution satellite altimetry became available in the 1970s. Mapping techniques have improved over time, but only the use of sound (sonar) has permitted large-scale, high-resolution seafloor measurements. Despite this long history of mapping the seafloor, only about 10% to 15% of the ocean has yet been mapped in high-resolution.

Tracklines from (left) echosounding surveys using low-resolution single-beam and (right) high-resolution multibeam surveys collected during marine cruises. The figures show the regions of the ocean that have been mapped using sound. Data sources (1939 to present) from U.S. and non-U.S. oceanographic institutions, universities, and government agencies with worldwide data coverage. Images credit: NOAA National Centers for Environmental Information, Marine Trackline Geophysical Database.
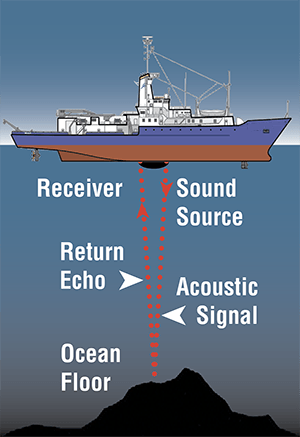
Illustration of echosounding. Image Credit: DOSITS.
In a basic, single-beam sonar system, a combined transmitter and receiver, called a transducer, mounted on the bottom of a ship generates a single sound pulse. The pulse travels downward through the water, reflects off the ocean bottom, and then returns to the surface where it is detected by the transducer. The ocean depth is calculated by knowing how fast sound travels in the water (approximately 1,500 meters per second) and measuring the time it takes the sound to travel to the bottom and return. This method of seafloor mapping is called echosounding. Seismic reflection and seismic refraction, used to study the layers below the sea floor, also produce an ocean sea floor map. While faster and more accurate than traditional methods, echosounding only measures a single location directly under the ship and is inefficient for mapping large areas of the ocean floor.
For most of the ocean, maps of bathymetry rely on sea surface-based altimetry data from satellites. However, this data is low resolution. While satellite data provide a very good map for large scale features, as of 2014, satellite data could at best resolve features of approximately 1.5 km (0.93 miles) or larger.
In contrast, satellite radar has been used to map approximately 98% of Venus at 100 m (328 ft) resolution, all of Mars has been mapped at 100 m (32 ft) resolution or 20 m (66 ft) resolution, and the Moon has been entirely mapped at 100 m (328 ft) resolution or higher. It is much easier to map surfaces that are not covered in water. Because radar does not penetrate water, other methods must be employed to achieve high resolution mapping below the surface of the ocean.

Global seafloor topography measured and estimated from gravity data that is derived from satellite altimetry and shipboard depth soundings. Image credit: NOAA / NESDIS Center for Satellite Applications and Research.
Multibeam sonar systems were developed to produce more accurate maps of the seafloor. In a multibeam sonar system, the sound energy from the transducer is emitted in the shape of a fan that spreads downward to the seafloor. The area of the seafloor ensonified is called the swath. A multibeam sonar system uses a signal processing technique called beamforming to determine directional information from returning sound signals. A multibeam system keeps track of the ship’s roll, pitch, and yaw for accurate directional computations. A multibeam system can measure a swath width between 1.3 and 6 times the water depth. For example, in 1,000 m (3,280 ft) of water, a swath width could be 1,300 m to 6,000 m (4,265 ft to 19,685 ft) depending on the system used. Multibeam systems mounted on ship hulls can achieve a spatial resolution of between 30 m (98 ft) and 100 m (328 ft), depending on the water depth. Resolution generally decreases as water depth increases. Much of the high-resolution mapping has been conducted in coastal areas. For example, the NOAA Hydrographic Survey maps more than 5,000 square nautical miles each year along the U.S coast.

Illustration of multibeam sonar from both a ship and a towed instrument to map the seafloor. Image credit: NOAA Ocean Explorer, Bermuda: Search for Deep Water Caves 2009.
To achieve even higher resolution, down to 1 meter, multibeam sonar systems can be mounted on towed instruments or autonomous underwater vehicles. These instruments are operated close to the seafloor to increase the resolution but reduces the swath coverage. This high resolution is necessary for activities such as searching underwater for the debris from a plane accident.

A section of seafloor southwest of Australia that was searched for debris from Malaysian Airlines flight MH370. The image on the left shows the satellite derived bathymetry, the image on the right shows the much higher resolution multibeam swath mapped through this section of sea floor. Colors indicate depth with blue being deeper and red being shallower. Image © Commonwealth of Australia (Geoscience Australia) 2018.
Because multibeam sonar is digital, maps of the seafloor can be generated from different perspectives and in three dimensions.

Multibeam bathymetry of the Pao Pao Seamount (right) and an unnamed guyot (left), near American Samoa in the Pacific Ocean, shows one example of nearby seamounts with very different geomorphology. Pao Pao Seamount comes to a very sharp peak at around 300 meters and shows steep flanks while the unnamed feature has a distinct flat top. The seamounts are 25 kilometers apart from each other. Image credit: NOAA Office of Ocean Exploration and Research, Discovering the Deep: Exploring Remote Pacific MPAs.
Backscatterfrom multibeam sonar can also be used to determine the seafloor composition (e.g., mud, sand, rock) and even identify gas seeps in the water column.

A view of multibeam sonar water column backscatter data used aboard the NOAA Ship Okeanos Explorer to detect gas seeps. Gas seeps detected along the ship track are imaged as colored plumes rising from the seafloor. The different colors reflect different backscatter intensities. An individual multibeam sonar fan image is show, illustrating the sonar return in the water column. Image courtesy of the NOAA Okeanos Explorer Program.
Additional Links on DOSITS
- People -> Navigation -> How is sound used to find objects on the ocean bottom?
- People -> Navigation -> How is sound used to measure water depth?
- People -> Study Earth -> How is sound used to study the Earth’s history?
- People -> History of Underwater Acoustics
- Tech Gallery -> Observing Sea Floor -> Multibeam Echosounder
- Tech Gallery -> Observing Sea Floor -> Echosounder
- Tech Gallery -> Observing Sea Floor -> Side Scan Sonar
Additional Resources
- NOAA National Center for Environmental Information
- Topex – Interactive Seafloor Topography Map
- NOAA Okeanos Explorer – Ocean Mapping
- NOAA Hydrographic Survey
- Geoscience Australia: MH370 Phase One Data Release
- NASA – Map of the Moon and Arizona State Press Release 2011 Moon Map
- NASA – Mars mapping News release from 2010
- NASA – Mars mapping JPL news release and map of Mars
- NASA – Magellan – Mapping Venus
- European Space Agency – Mapping Mars
References
- Hwang, C., & Chang, E. T. Y. (2014). Seafloor secrets revealed. Science, 346(6205), 32–33. https://doi.org/10.1126/science.1260459
- Montereale-Gavazzi, G., Roche, M., Lurton, X., Degrendele, K., Terseleer, N., & Van Lancker, V. (2018). Seafloor change detection using multibeam echosounder backscatter: case study on the Belgian part of the North Sea. Marine Geophysical Research, 39(1–2), 229–247. https://doi.org/10.1007/s11001-017-9323-6
-
Mortimer, C. H., & Worthington, E. B. (1940). A New Application of Echo-Sounding. Nature, 145(3667), 212–214. https://doi.org/10.1038/145212a0
-
Sandwell, D. T., Muller, R. D., Smith, W. H. F., Garcia, E., & Francis, R. (2014). New global marine gravity model from CryoSat-2 and Jason-1 reveals buried tectonic structure. Science, 346(6205), 65–67. https://doi.org/10.1126/science.1258213
-
Witze, A. (2014). Gravity map uncovers sea-floor surprises. Nature. https://doi.org/10.1038/nature.2014.16048