How is sound used to measure, detect, and track oil?
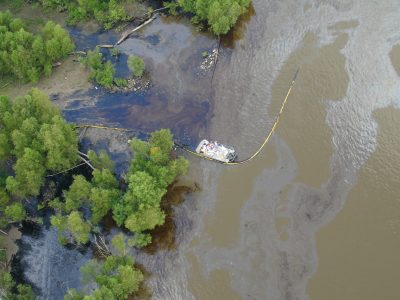
Oil spills, such as this one in the Mississippi River (2008), can harm people and the environment, substantially disrupt marine transportation, and cause widespread economic impacts. Knowing where the oil is, where it may travel to, and how quickly it may come ashore is important in mitigating an oil spill. Image credit: John Tarpley, Office of Response and Restoration, NOAA National Ocean Service.
Oil spills happen along the coast, as well as in lakes and rivers. Their environmental impacts can be considerable. Light oils are highly toxic to marine life but evaporate quickly. Heavy oils are less toxic but persist in the environment longer, potentially mixing with pebbles and sandy beaches where they remain for years. Oil spill surveillance is an important part of oil spill management. Technological advancements, including developments in underwater acoustics, continue to help scientists and managers identify spills before they cause widespread damage.
In the case of the 2010 Deepwater Horizon (DWH)/Macondo Well incident (BP Gulf Oil Spill), in which approximately 4.9 million barrels (210 million US gal) of oil spilled into the Gulf of Mexico, high-frequency backscatter techniques were used to detect oil in the water column. One challenge of the Deepwater Horizon spill was that a significant quantity of oil remained in the water column, well below the water surface, even after the wellhead was closed. This trapped oil posed a serious environmental risk. High frequency acoustic backscattering methods were used to quantify the amount of oil in the water column and to track submerged oil. Oil droplets in the water column scattered transmitted acoustic signals, allowing for oil detection.
Acoustic technologies have also been used to determine the thickness of oil layers on the surface. A laser aboard an aircraft generates an acoustic pulse that travels through the oil until it reaches the oil-water interface. The time required for the pulse to travel through the oil and back to the surface is used to measure the oil’s thickness.
Real-time response buoys in the Gulf of Mexico have been outfitted with acoustic sensors to map the possible path of an oil spill. The Texas Automated Buoy System (TABS) provides near real time data that help spill response managers decide where to deploy personnel, ships, and cleanup equipment to minimize the impact of a spill. Acoustic current profilers measure near-surface currents and current profiles.
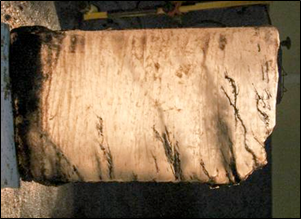
A slab of ice cut from a laboratory-grown ice sheet shows the percolation of oil up into brine channels. Image courtesy of Chris Bassett, NOAA. Adapted from Bassett et al., 2016.
Decreases in summer ice extent in the Arctic will increase the risk of oil spills due to increased tourism, shipping, and oil and gas development. One concern is that a spill could occur underneath the sea ice, complicating spill detection and remediation. Underwater vehicles can now be successfully operated below sea ice, allowing the deployment of upward facing sensor packages. Recent work has highlighted the potential of deploying acoustic instruments to “see” what sea ice “looks like”, determine important scattering features, identify discrete boundaries (water-oil, oil-ice, and ice-oil), and measure oil thickness.
Sea ice has a complex structure. Laboratory experiments of oil injected under sea ice revealed that oil is highly mobile and spreads along the bottom of an ice sheet, flowing towards regions of thinner ice and percolating up through various pockets and channels.
When oil pools beneath the ice, it forms layers of seawater, oil, and ice. Active acoustic backscattering methods can detect discrete reflections from each interface, the thickness of the oil layer may be determined, and its extent mapped. The use of active acoustics, in combination with upward-looking camera systems, can be very effective in detecting oil under sea ice, determining oil layer thickness, and monitoring the boundaries of a slick as it spreads.
Additional Links on DOSITS
- Science of Sound > Scattering
- Technology Gallery > Acoustic Doppler Current Profiler
- People and Sound > How is sound used to explore for oil and gas?
- Audio Gallery > Ship
Additional Resources
- Texas Automated Buoy System (TABS): Real-time ocean observations supporting oil spill prevention and response. https://tabs.gerg.tamu.edu
- Jha, Maya Nand, Jason Levy, and Yan Gao. 2008. Advances in remote sensing for oil spill disaster management: State-of-the-art sensors technology for oil spill surveillance. Sensors. 8: 236-255.
- Walpert at al. 2014. TABS Responder- A quick response buoy to supplement the TABS Network. 2014 Oceans – St. John’s. Pp: 1 – 6. doi: https://doi.org/10.1109/OCEANS.2014.7003137.
References
- Bassett, C., Lavery, A. C., Maksym, T., & Wilkinson, J. P. (2016). Broadband acoustic backscatter from crude oil under laboratory-grown sea ice. The Journal of the Acoustical Society of America, 140(4), 2274–2287. https://doi.org/10.1121/1.4963876
- Camilli, R., Di Iorio, D., Bowen, A., Reddy, C. M., Techet, A. H., Yoerger, D. R., … Fenwick, J. (2012). Acoustic measurement of the Deepwater Horizon Macondo well flow rate. Proceedings of the National Academy of Sciences, 109(50), 20235–20239. https://doi.org/10.1073/pnas.1100385108
- Fingas, M., & Brown, C. (2014). Review of oil spill remote sensing. Marine Pollution Bulletin, 83(1), 9–23. https://doi.org/10.1016/j.marpolbul.2014.03.059
- Wilkinson, J. P., Boyd, T., Hagen, B., Maksym, T., Pegau, S., Roman, C., … Zabilansky, L. (2015). Detection and quantification of oil under sea ice: The view from below. Cold Regions Science and Technology, 109, 9–17. https://doi.org/10.1016/j.coldregions.2014.08.004
- Xenaki, A., Gerstoft, P., & Mosegaard, K. (2013). Modeling and detection of oil in sea water. The Journal of the Acoustical Society of America, 134(4), 2790–2798. https://doi.org/10.1121/1.4818897