How are sounds viewed and analyzed?
Most natural sounds have multiple frequencies and intensities that change over time. Scientists and musicians often use graphics to display the components present in a sound. Throughout this website, visualizations are used to help describe sound. In the Audio Gallery, for example, each sound may be displayed as an animated frequency spectrum, a waveform and spectrogram.
First, listen to a series of tones ranging from 200 Hz to 475 Hz at 25 Hz intervals.
Tones ranging from 200 Hz to 475 Hz at 25 Hz intervals. Sound credit: University of Rhode island.
To see the frequencies present, the sound is displayed below as a frequency spectrum graph. The graph below plots the amount of energy in the sound at each frequency.
Frequency spectrum of a series of tones. Image credit: University of Rhode Island.
Each frequency appears as a sharp peak in this example.
Most natural sounds are complex with loud and soft frequency components. Listen to the recording of a fish, the Atlantic croaker, below.
Sound made by a fish, the Atlantic croaker. Loud croaking sounds from both female and male croakers. These sounds were recorded in a test tank and are due to manual stimulation. Sound from CD Supplement to: Sounds of the Western North Atlantic Fishes by Fish & Mowbray, 1970. CD © University of Rhode Island, 2001
Below is the frequency spectrum of a sound made by the fish, the Atlantic croaker.
Frequency spectrum of a sound made by the fish, the Atlantic croaker. Image credit: University of Rhode Island.
The frequency spectrum above shows all the frequencies throughout the whole sound. An animated frequency spectrum shows just the frequencies present at each moment in time. You can see what frequencies are associated with each part of a sound. The animated spectrum of the “tones” sound is below.
Animated frequency spectrum of a series of tones. Image credit: University of Rhode Island.
You can see how each tone has a peak in intensity at a slightly different frequency. As the sound travels from one tone to the next, there is some overlap in the display due to the analysis method.
The animated spectrum below is of the same Atlantic croaker. Notice that there is energy (or intensity on these axes) at many frequencies in each part of the sound. The amount of energy at specific frequencies changes for the different sounds made by the Atlantic croaker.
Animated frequency spectrum of the Atlantic croaker. Sound from CD Supplement to: Sounds of the Western North Atlantic Fishes by Fish & Mowbray, 1970. CD © University of Rhode Island, 2001
We can easily hear the different frequencies and when they occur in the Atlantic croaker sound. However, there are many sounds for which the human ear cannot sort out the frequencies. The frequency spectrum allows us to “see” the frequencies.
Sound is also commonly shown as a waveform. A waveform graphs sound pressure as it changes with time. Sound pressure is positive when the sound wave is compressing the medium through which it is traveling. Sound pressure is negative when the medium is being expanded by the sound wave.
Below is the waveform of a 250 Hertz (Hz) tone at a constant amplitude.
A 250Hz tone. Sound credit: University of Rhode island.
Below is the waveform of a complex sound made by the Atlantic croaker. As the waveform shows, the loudness and frequency of the croaker’s vocalizations change with time.
Another way to look at sound is with a spectrogram. A spectrogram shows the frequencies present and at what times in the sound they are present. A spectrogram displays different sound energy levels with different shading or colors. Here, dark colors (blue and black) are low energy and light colors (yellow and white) are high energy.
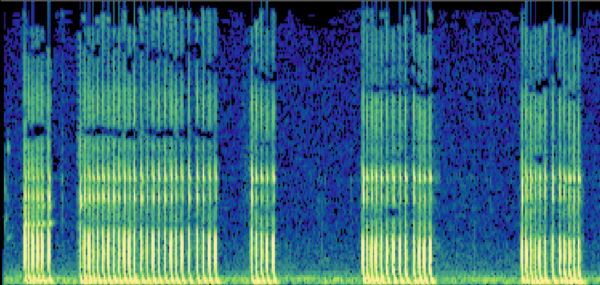
Spectrogram of the Atlantic croaker. Image by University of Rhode Island. Sounds from CD Supplement to: Sounds of the Western North Atlantic Fishes by Fish & Mowbray, 1970. CD ©University of Rhode Island, 2001.
The animated spectrogram below is of the Atlantic Croaker. The waveform is displayed above the spectrogram. The movie reveals the spectrogram as the sound is played, allowing the viewer to see where they are in the spectrogram. These movies help visualize the sound.
The animated spectrogram below is of another animal, a Weddell seal.
All sounds in the Interactive Audio Gallery have an animated spectrogram. Spectrograms are also used to illustrate features of some sounds in the Audio Gallery and Animals and Sound section of this web site.
Additional Links on DOSITS
Additional Resources
- NOAA PMEl Acoustics Program – Spectrograms.