Detection Threshold for Sonar
Sonar (SOund Naviation And Ranging) is a technology that uses acoustical waves to detect and locate objects in the ocean. Active sonar systems, such as fish finders, echosounders, side-scan sonars, and military sonars, transmit a pulse of sound and then listen for echoes. Passive sonar systems listen to underwater sounds to detect signals of interest, such as those generated by animals, volcanoes, submarines, shipping noise, and other sources.
The relative levels of the signal of interest and the background noise in the ocean determine whether or not a sonar system can detect the echo from a target or a sound generated by a source. In order to decide if a signal is present, the sonar operator or designer sets a detection threshold such that when the ratio of the signal level to the noise level at the receiver exceeds this threshold, the decision "signal present" is made. The decision "signal absent" is made when the signal-to-noise (SNR) ratio is below the detection threshold.
The "sonar equation" is a systematic way of estimating the expected SNR for a sonar system at a given time and place and for a specific range and depth. Slightly different versions of the sonar equation are used for active (echo-ranging) and passive sonar systems. The signal-to-noise ratio (SNR) at a receiver that is co-located with an active sonar is:
SNR (decibels) = SL – 2TL + TS – NL
where SL is the source level, TL is the transmission loss between the sonar/receiver and the target, TS is the target strength, and NL is the ambient noise level. The SNR, source level, transmission loss, target strength, and noise level are all given in decibels.
Echo ranging and sonar parameters. Adapted from Urick, 1983.
The amount by which the SNR exceeds the detection threshold, DT, is called the signal excess (SE):
SE (decibels) = SNR – DT = (SL – 2TL + TS – NL) – DT
If the SE is greater than 0 dB, then the decision is made that the target is present. If the SE is negative, the decision is that the target is not present.
If the detection threshold is set high (which is equivalent to assuming that the signal power is high relative to the noise) only strong targets will exceed the threshold and be detected. There will not be many "false alarms" in which noise is mistakenly decided to be the signal of interest; however, there may be many "misses" in which the signal, though present, is not detected. If the threshold is set low, weaker targets will be detected, but the number of "false alarms" will also increase.
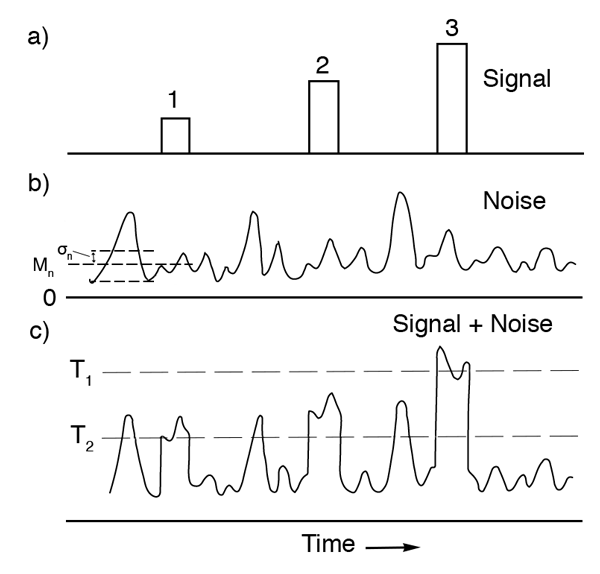
The following figure shows the importance of setting the detection threshold. The top trace (a) shows three target echoes with different amplitudes. The middle trace (b) shows the noise. The bottom trace (c) shows the result when the signal is added to the noise, together with two possible threshold settings (T1 and T2). If the detection threshold is set at the higher level T1, only the strongest of the three echoes will be detected, but there will not be any false alarms caused by peaks in the noise. If the detection level is set at the lower level T2, all three echoes will be detected, but there will also be a number of false alarms.
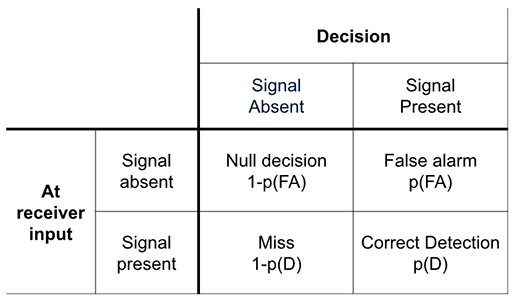
There are four possible outcomes in deciding whether or not a target signal is present:
- The signal is present, and the correct decision is made that the signal is present. The probability that if a signal is present, the correct decision will be made is called the detection probability p(D).
- The signal is present, but the incorrect decision is made that the signal is absent (a "miss"). The probability of this incorrect decision is 1 – p(D).
- The signal is absent, but the incorrect decision is made that the signal is present (a "false alarm"). The probability of this incorrect decision is called the false alarm probability p(FA).
- The signal is absent, and the correct decision is made that the signal is absent (a "null decision"). The probability of this correct decision is 1 – p(FA).
The following table summarizes the possibilities:
A false alarm is also called a false positive, and a miss is also called a false negative. (For more detail, please visit the DOSITS Advanced Topic on Statistical Uncertainty.)
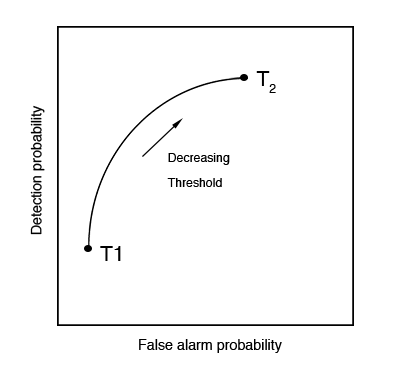
To help select an appropriate detection threshold that balances the probability of correct and incorrect decisions, a receiver-operating-characteristic (ROC) curve can be constructed. The ROC curve that results from the two possible threshold settings (T1 and T2) described above is shown in the figure below. By decreasing the detection threshold, the detection probability increases (correct decision), but the false alarm probability also increases (incorrect decision).
The detection threshold is usually selected to maximize the probability of detection for a given probability of false alarm (called the Neyman-Pearson criterion). In this case, the following equation describes the relationship between the probability of detection and the false alarm probability as a function of the (dimensionless) signal-to-noise ratio SNR[1]Ziomek, L. J. (1995). Fundamentals of acoustic field theory and space-time signal processing. Boca Raton: CRC Press.:
$latex \displaystyle p(D) = p(FA)^ &s=3$
The SNR in this equation is that measured at the output of the receiver, where the decision of whether or not a signal is present is made. This equation can be manipulated to give an expression for the SNR that is required in order to obtain the desired p(D) for a given p(FA). Note that the SNR in this equation is the ratio of signal power to noise power with no units (SNR (unitless)) and that SNR (decibels) = 10 log (SNR (unitless)).
Historically the human auditory system was the earliest detection device used in sonar. It is still used in sonar systems, and in some situations its performance approaches that of a computer.
Cited References
| ⇡1 | Ziomek, L. J. (1995). Fundamentals of acoustic field theory and space-time signal processing. Boca Raton: CRC Press. |
|---|